Creating visualization
To create visualization, go to the „Visualize” tab from the main menu.
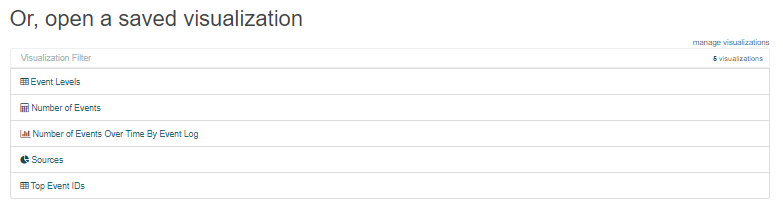
A new page will be appearing where you can create or load visualization. To load previously created and saved visualization, you must select it from the list.
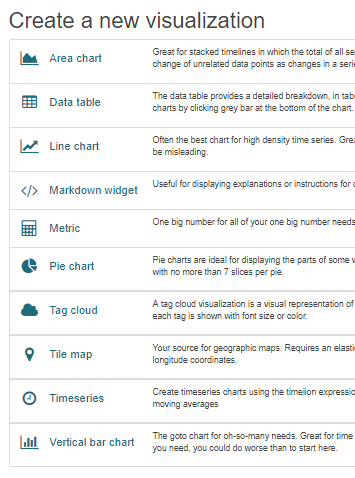
In order to create a new visualization, you should choose the preferred method of data presentation. Next, specify whether the created visualization will be based on a new or previously saved query. If on new one, select the index whose visualization should concern. If visualization is created from a saved query, you just need to select the appropriate query from the list, or (if there are many saved searches) search for them by name.