Dashboards
Dashboard is a collection of several visualizations or searches. Depending on how it is build and what visualization it contains, it can be designed for different teams e.g.:
- SOC - which is responsible for detecting failures or threats in the company;
- business - which thanks to the listings can determine the popularity of products and define the strategy of future sales and promotions;
- managers and directors - who may immediately have access to information about the performance units or branches.
To create a dashboard from previously saved visualization and queries, go to the „Dashboard” tab in the main menu bar. When you open it, a new page will appear.
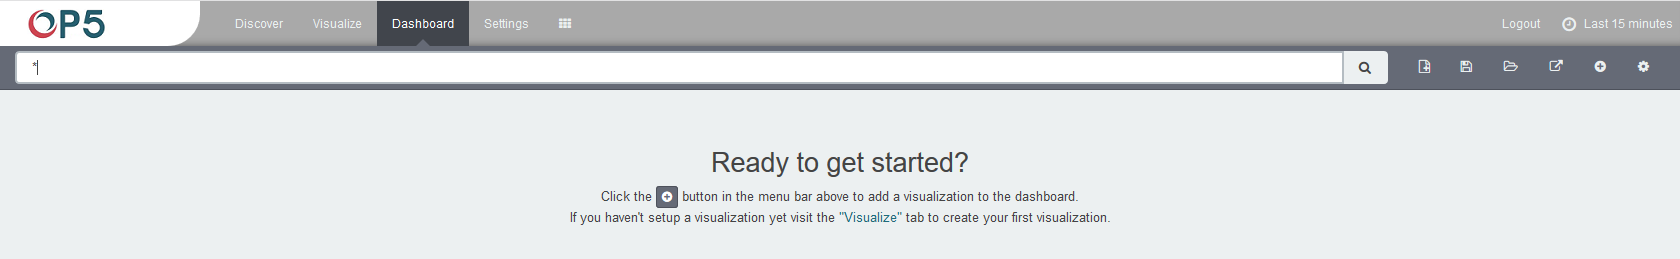
Clicking on the icon  and selecting a saved query and / or
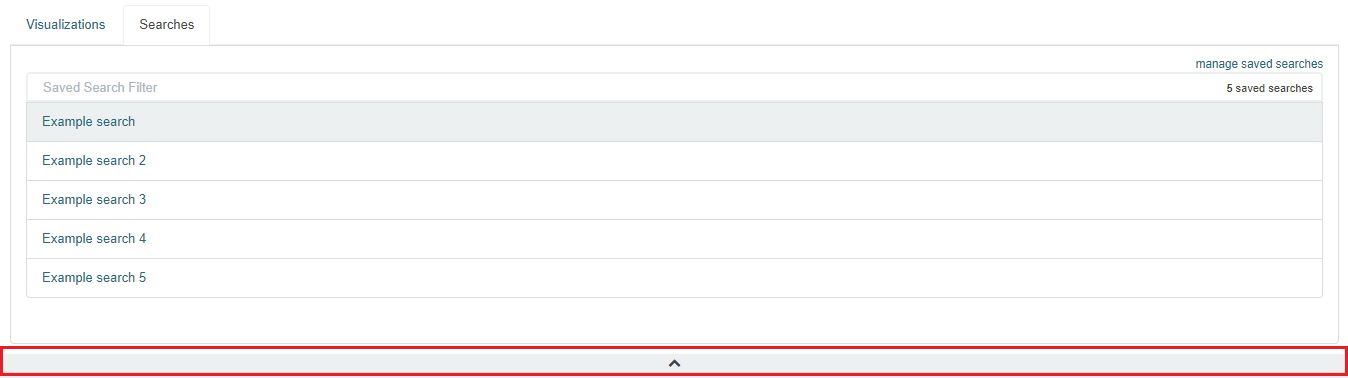
visualization from the list will add them to the dashboard. If, there
are a large number of saved objects, use the bar to search for them by
name. To collapse the window for adding objects, click on the gray bar
with icon
and selecting a saved query and / or
visualization from the list will add them to the dashboard. If, there
are a large number of saved objects, use the bar to search for them by
name. To collapse the window for adding objects, click on the gray bar
with icon  (the windows can be re-opened by clicking the icon
to the right of the query bar again).
(the windows can be re-opened by clicking the icon
to the right of the query bar again).
Elements of the dashboard can be enlarged arbitrarily (by clicking on the right bottom corner of object and dragging the border) and moving (by clicking on the title bar of the object and moving it).
To save a dashboard, click on the icon
 to the right of the query bar and give
it a name. To load the dashboard go to the “Settings” tab in the main
menu at the top of the page, then “Object” from the submenu and
finally in the “Dashboard” tab. Here you can also go into advanced
editing mode, export and delete dashboard.
to the right of the query bar and give
it a name. To load the dashboard go to the “Settings” tab in the main
menu at the top of the page, then “Object” from the submenu and
finally in the “Dashboard” tab. Here you can also go into advanced
editing mode, export and delete dashboard.